Reading 'Tableau Thorough Introduction'
→ 日本語版を読むOverview
I read "Tableau Thorough Introduction" and summarized its contents. However, I only read all of Chapter 1 and part of Chapter 5.
Chapter 1: Creating Data Sources
Chapter 5: Features for Getting More Out of Tableau
Impressions After Reading
I was happy that quite a few pages were dedicated to data source creation, which is the step before creating charts and graphs.
It was also good that performance tuning and notification features were covered.
I wish it had gone a bit deeper on how relationships work.
Tableau Products
The following product suite is available. There are many more specific products.
- Tableau Prep
- Tableau Desktop
- Tableau Server & Tableau Cloud
- Tableau Mobile
The workflow is: preprocess data with Tableau Prep, visualize it in Tableau Desktop or Tableau Server & Tableau Cloud, and share it through Tableau Server & Tableau Cloud. With Tableau Mobile, you can view dashboards on your smartphone.
Terminology
- Data Source (.tds file)
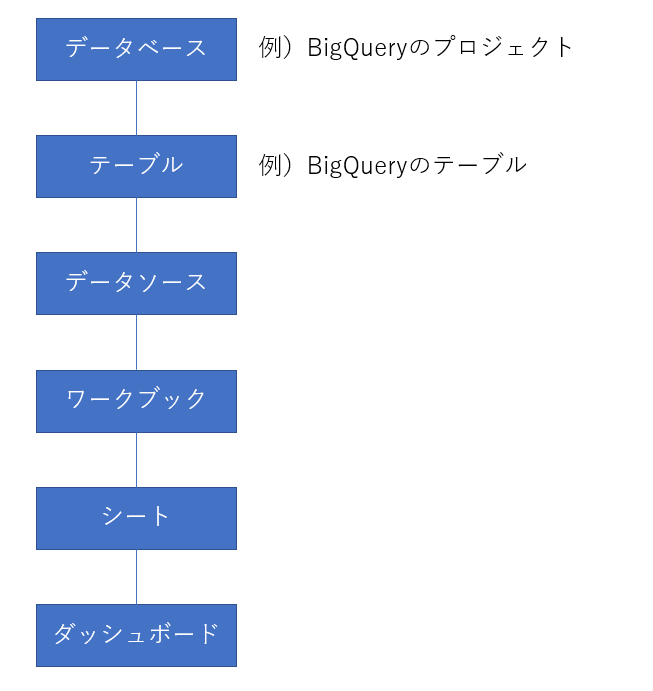
- Data loaded from a connection target (includes connection information, field data types, calculated field definitions, table join processing, etc.)
- Extract (.hyper file)
- A copy of the connection target data created when the data source connection type is set to Extract
- Workbook (.twb file)
- A workspace for creating charts based on one or more data sources. Contains data sources, worksheets, and dashboard information.
- Worksheet
- The screen within a workbook where charts and tables are created
- Dashboard
- Displays charts and tables from multiple worksheets on a single screen
- Story
- A sequence of visualizations that work together to convey information
- View
- Displays a single chart or table created in a worksheet
- Project
- A bundle of multiple child projects and workbooks
- Packaged Data Source (.tdsx file)
- A file format that combines an extract and a data source
- Packaged Workbook
- A file that includes a workbook plus the extract and local files used in the workbook (such as image files)
My Tableau Repository
The folder where files related to Tableau Desktop are stored. Contains workbooks, data sources, and other files used by Tableau Desktop. Automatically created when Tableau Desktop is installed.
About NULL
- When dividing by 0 using the DIV function, no error occurs — NULL is returned. In Tableau, NULL is returned when a calculation cannot be performed.
- Values that are not valid for the data type also become NULL. For example, converting a Japanese string to INT type.
- The ZN function converts NULL to 0.
- The IFNULL function can convert NULL to any arbitrary value.
Aggregation and Grouping
Nothing I'm likely to forget, so I'll skip this.
[Column] Fan Trap
For example, suppose you join a sales detail table with a product table using the product code.
If the product table has multiple rows with the same product code (i.e., duplicate product codes), joining them can result in more rows than the original sales detail table. Calculating the total sales in this state will yield a higher amount than the actual sales.
Using the Relationships feature allows you to perform joins while avoiding fan traps.
Custom SQL
A feature that connects to the result of a SQL query defined in Tableau, rather than reading tables or views from the database.
Not recommended from a data governance perspective. The best practice is to create tables or materialized views on the database side and connect to those.
Relationships
Apparently a Tableau feature for intelligently integrating multiple tables.
-
A relationship does not perform a join when defined. Integration occurs when fields from both tables are used in a worksheet. If a view can be created using only one table, no integration occurs.
-
Integration is performed on the pre-join aggregated result, which avoids fan traps. What this means is that each table is aggregated by the condition values, and then the aggregated results are joined. Fan traps occurred because joining duplicated rows before aggregation, but this approach prevents that.
-
In relationships, the join type dynamically changes based on dimensions and measures.
Optimizing Relationships Using Performance Options
By changing performance options, you can optimize relationship processing and improve performance.
- Cardinality
- The relationship between the number of rows satisfying the join condition between tables. Default & recommended setting is "Many to Many."
- Referential Integrity
- All records match: All values in a table's field always match a value in the other table's field.
- Some records match: Default & recommended setting. Some values in a table's field match the other table's field values, or the degree of matching is unknown.
Logical Layer and Physical Layer
-
Logical Layer: Integrates logical tables using relationships.
-
Physical Layer: Defines joins and unions of physical tables. Joins and unions multiple physical tables to create a single logical table.
Cross-Database Join
Allows you to integrate tables from different connection targets, such as BigQuery and Excel.
On the data source setup screen, click the "Add" button next to "Connections" to add a new connection target.
Connection Types
There are two types: "Live Connection" and "Extract Connection." This is important as it affects performance and available functions.
Extract connection performs in-memory processing in the Tableau environment, which often results in faster processing. Additionally, frequent extracts can bring it close to real-time. For these reasons, extract connection is generally preferred over live connection.
Furthermore, with extract connection, all Tableau functions are available.
Extract connection also does not put load on the connection target server.
-
Live Connection: The data source maintains a constant connection to the target, so the latest data is always retrieved. Most processing such as aggregation and joins is executed in the target environment.
-
Extract Connection: Copies data from the connection target and creates an extract file in Tableau. The data source connects to the extract file in Tableau. Since extracts are in a format optimized for Tableau, faster processing can be expected.
※ If the connection target is Excel, JSON, PDF, etc., there is little performance difference between live and extract connection. This is because even with live connection, processing is accelerated using a file called a "shadow extract."
Incremental Refresh and Full Refresh
Covered in a separate post, so skipping here.
Extract Filters and Data Source Filters
By excluding unnecessary data with extract filters, you can reduce the size of the extract file.
Note that data source filters apply filtering after the extract file has been created, so data source filters cannot reduce the size of the extract file.
Performance Tuning
In general, it is said that users start to feel stressed when a web page takes 3 seconds to load.
If there are performance issues, it is best to investigate in the order of data source, worksheet, and dashboard.
- Data Source
- Live connection is being used without a good reason
- The amount of data in extract connection is too large
- In Tableau Cloud, performance starts to gradually degrade when the number of rows in an extract exceeds 1,000
- Response within 3 seconds becomes very difficult when rows exceed 100 million
- As a countermeasure, exclude unnecessary data with extract filters. Avoid making the data source too granular (e.g., datetime → date)
- Worksheet
- Too many cells (points, marks) in the view, causing slow calculation and rendering
- Relationships with an extremely large number of join targets
- As a countermeasure, reduce integrations via relationships in the logical layer, and pre-join in the physical layer
- Dashboard
- Too many worksheets displayed in the dashboard
- When the number of worksheets exceeds 20, rendering takes several seconds
- Dashboard size is not fixed
- Fixing the size makes it easier for Tableau Cloud to use caching
- Too many worksheets displayed in the dashboard
Performance Recording
The "Performance Recording" feature allows you to identify bottlenecks.
You can analyze bottlenecks based on worksheets and SQL.
"Help" → "Settings and Performance" → "Start Performance Recording"
Publishing
Publishing refers to making workbooks or data sources available on Tableau Cloud.
Recommended Connection Configuration
Extract from the data source to a Tableau Cloud data source. Connect from Tableau Desktop to the Tableau Cloud data source via live connection.
Tableau Bridge
Sends data from inside a firewall to Tableau Cloud.
Notification Features
- Subscription
- A feature that periodically delivers dashboards as images or PDFs via email
- Sent upon extract completion or on a schedule
- Open a worksheet, then select "Subscribe" from the "View" menu in the toolbar
- Data-Driven Alerts
- Sends email or Slack notifications when a measure in a published workbook meets a specific condition
- The condition is that the numerical value you want to use for the alert must be selectable as text in the view
- Open a worksheet, then select "Alert" from the "View" menu in the toolbar
Tableau Lineage Diagram