Alerts in Azure
→ 日本語版を読むOverview
In general, the following three types of alerts are used.
- Log alerts
- Activity log alerts
- Metric alerts
Log Alerts
Queries are executed against logs stored in LogAnalytics workspace tables, and alerts are triggered when logs containing specific strings or numeric values exceeding a threshold are found.
For example, when monitoring CPU usage on Windows, you can check whether matching logs exist using a query like the one below, and alert when they are found.
The following example is a query that searches for logs where CPU usage is 80% or higher, running against the Perf table in the LogAnalytics workspace.
You can also search for logs containing specific strings and alert accordingly.
Perf | where ObjectName == "Processor Information" and CounterName == "% Processor Time" and CounterValue > 80
Activity Log Alerts
Activity log alerts allow you to set alerts for operations (actions) such as deleting a storage account.
For storage account deletion, the action name is as follows:
Microsoft.Storage/storageAccounts/delete — Deletes an existing storage account.
Below is the list of actions:
Azure Resource Provider Operations | Microsoft Learn
Activity log alerts can only be created up to 100 per subscription, so if you reach the limit, implement alert rules using log alerts instead of activity log alerts.
Metric Alerts
As mentioned above, log alerts can also be used to set alerts for metrics such as CPU usage.
The biggest difference between log alerts and metric alerts is that log alerts are stateless while metric alerts are stateful.
Stateful alerts fire when the condition is met. As shown in the table below, they will not fire again or trigger further actions until the condition is resolved.
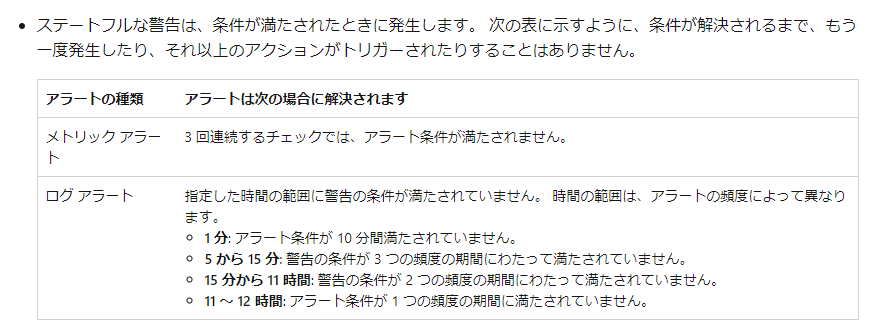
Overview of Alerts in Azure Monitor - Azure Monitor | Microsoft Learn
Another major difference from log alerts is that metric alerts support aggregations such as maximum and average values.
I saw a note somewhere that metric alerts support fewer metrics, and that log alerts should be used when metric alerts don't cover a case — but since guest metrics of VMs are also supported, I think coverage is fairly comprehensive.
When configuring metric alerts with Terraform, pay attention to the metric namespace.
When setting metric alerts for host metrics of a VM, the namespace is "Microsoft.Compute/virtualMachines", but for guest metrics it is "Azure.VM.Windows.GuestMetrics".
I got stuck on this for a while. I even thought it wasn't possible to set alerts for guest metrics, but since I could configure them in the Azure portal, I investigated and found that the metric namespace specification was wrong.
Alert Limits
There is a limit on the number of alerts that can be configured per subscription.
As mentioned above, activity log alerts can only be created up to 100 per subscription, so caution is needed.
If you reach the limit, implement alert rules using log alerts instead of activity log alerts.
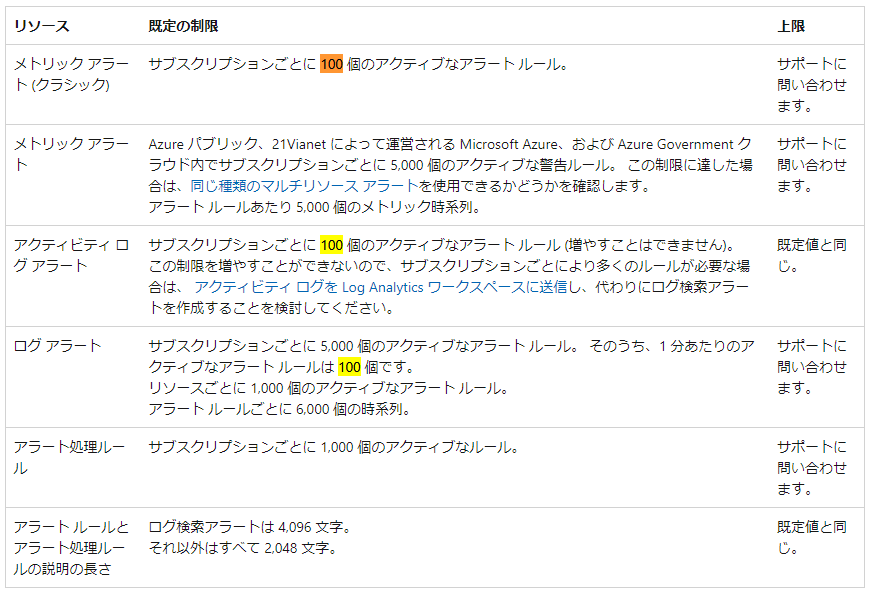
Azure Monitor Service Limits - Azure Monitor | Microsoft Learn